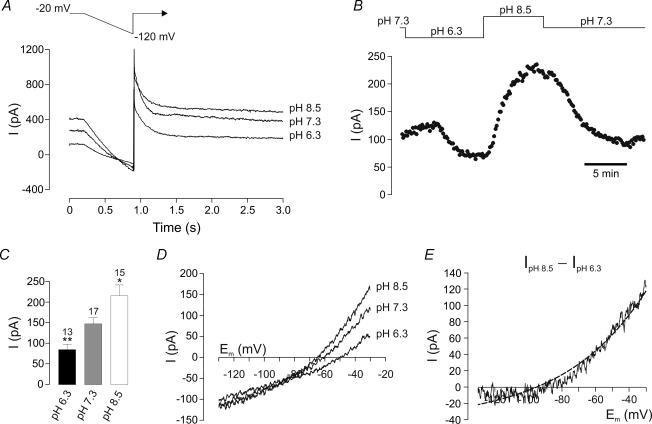
Figure 2. pH dependence of ISO.
A, typical traces from a DVN recorded in voltage clamp in Hepes-buffered ACSF at different pHo values. Acidification (pHo 6.3) reduces ISO at −20 mV, and alkalinization (pHo 8.5) increases it. Depolarization from −120 to −20 mV from −120 mV activates a large slowly inactivating outward current. B, current amplitude at −20 mV measured over the course of a recording. C, mean ISO at different pH values. Number of cells (n) is given above the bars. *P < 0.05; **P < 0.01 versus pHo 7.3 (unpaired t test). D, representative I–V relations from a DVN obtained at different pH values. E, I–V of the acidosis-inhibited current is described by the GHK current equation (dashed line).

