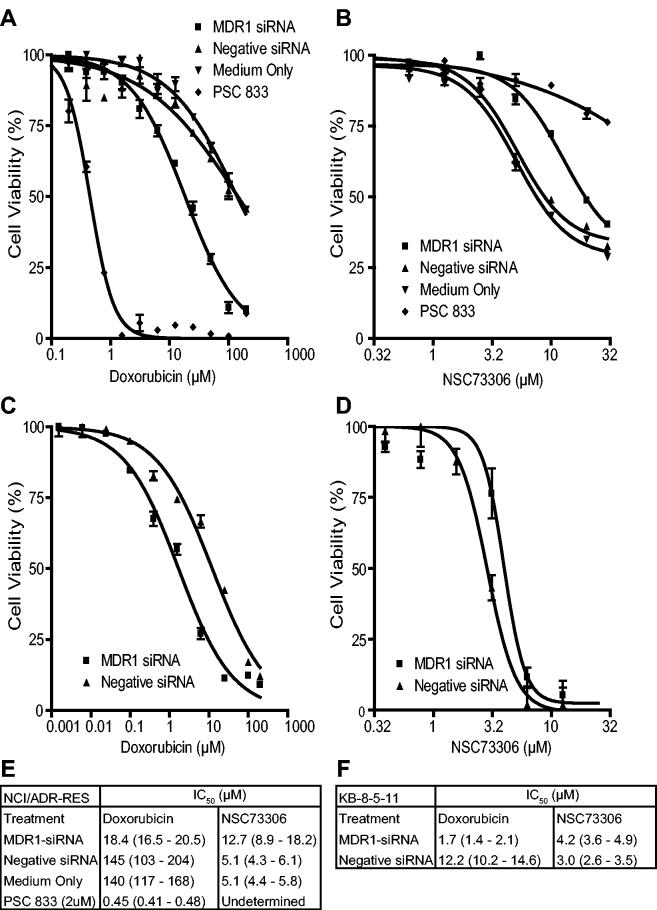
Figure 3.
Effect of siRNA targeted against MDR1 mRNA on P-gp positive NCI/ADR-RES ovarian carcinoma cells treated with doxorubicin or NSC73306. Dose response curves show NCI/ADR-RES cells treated with doxorubicin (A) or NSC73306 (B) for 72 hours following RNA interference (squares), negative siRNA (black triangles), growth medium only (circle), or PSC833 (white triangle). Dose response curves of KB-8-5-11 cells treated with doxorubicin (C) or NSC73306 (D) after either RNA interference (squares) or negative siRNA (black triangles). Error bars indicate 95% confidence intervals. IC50 values of NCI/ADR-RES (E) and KB-8-5-11 (F) are listed with 95% confidence intervals shown in parentheses.

