Figure 5.
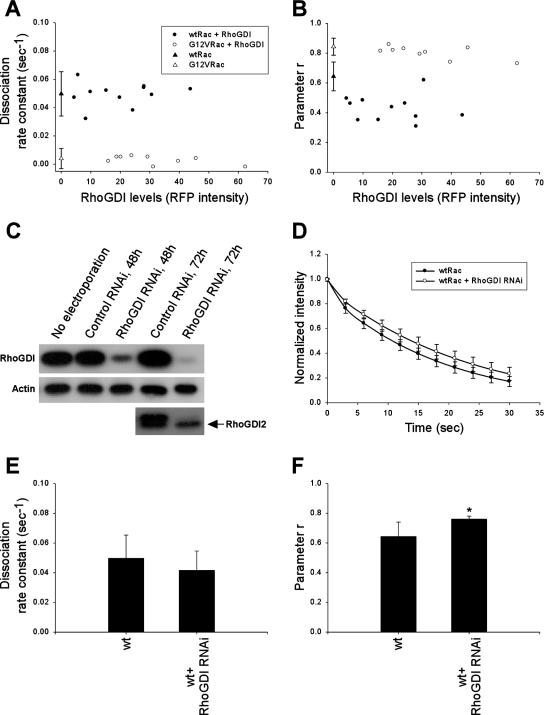
Role of RhoGDI in Rac–membrane dissociation. (A and B) koff values (A) and r values (B) of GFP-wtRac (•) or GFP-G12VRac (○) with increasing RFP-RhoGDI as determined by total RFP intensity. ▴ and ▵, the mean koff and r values ± SD of GFP-wtRac and GFP-G12VRac alone, respectively, as in Figure 4, C and D. (C) Cells were electroporated with pSUPER RNAi constructs for RhoGDI or control sequences. Total lysates were analyzed by immunoblotting for RhoGDI and RhoGDI2. The antibody to RhoGDI2 cross-reacts with RhoGDI, but RhoGDI2 runs at a lower position on the gel (arrow). Equal loading was verified by immunoblotting with anti-actin. Data are representative of at least three independent experiments. (D) Average best-fit curves to Equation (4) from cells expressing GFP-wtRac in the presence (n = 8) or absence (n = 11) of RhoGDI RNAi. Values are means ± SD. (E and F) koff (E) and r (F) values in protrusive areas of cells expressing GFP-wtRac alone (n = 11) or GFP-wtRac in the presence of RhoGDI RNAi (n = 8). Values are means ± SD (∗p <; 0.05 by Student's t test).

