Figure 5.
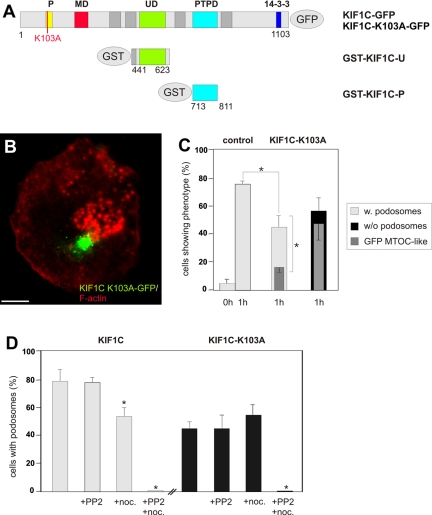
A KIF1C P-loop mutant is dislocalized and leads to podosome loss. (A) Domain organization of KIF1C and expression constructs used in this study: P-loop sequence (P; aa 97-104), motor domain signature (MD; aa 242-253), Unc104 domain (UD; aa 483-593), PTPD-1–binding domain (PTPD; aa 714-809), unspecified 14-3-3 binding region (14-3-3). Numbers indicate first and last amino acid residues of constructs. (B) Primary macrophage expressing GFP-labeled KIF1C K103A mutant (green), labeled for F-actin, confocal laser scanning micrograph of substrate-attached part of cell (superimposition of 4 images with z-distances of 1 μm). Note MTOC-like localization of GFP signal and scarcity of podosomes. (C) Evaluation of podosome reformation in macrophages expressing the KIF1C K103A mutant construct. Cells were treated with PP2 (0 h), followed by washout (1 h). Values for podosome formation are given as mean percentage ± SD of total counts. For each bar, 3 × 30 cells were evaluated. Control (pEGFP-C1): 0 h, 2.2 ± 1.5%; 1 h, 74.4 ± 1.5% for cells with podosomes; KIF1C-K103A: 1 h, 44.4 ± 7.8% for cells with podosomes, concurrent with 16.7 ± 2.6% of total cells showing a MTOC-like localization of the GFP signal; 55.6 ± 7.8% for cells without podosomes, concurrent with 45.6 ± 14.1% of total cells showing a MTOC-like localization of the GFP signal. For differences between control values and values gained with KIF1C-K103A expression (light gray bars), a p value < 0.01 was considered significant (indicated by asterisk); for a correlation between absence of podosomes (black bar) with an MTOC-like accumulation of GFP-KIF1C-K103A (dark gray bar), a p value < 0.02 was considered significant (indicated by asterisk). (D) Effect of microtubule disruption in cells expressing either KIF1C-GFP wt or KIF1C-K103A-GFP. Podosome formation was evaluated in untreated cells (unlabeled bars), after disruption with 25 μM PP2 and subsequent washout (+PP2), after addition of nocodazole (1 μM; +noc.), or after disruption with PP2 and addition of nocodazole to washout (+PP2+noc.). For each bar, 3 × 30 cells were evaluated. Values are given as mean percentage ± SD of total counts in Table 2, a p value < 0.04 was considered significant (indicated by asterisk).

