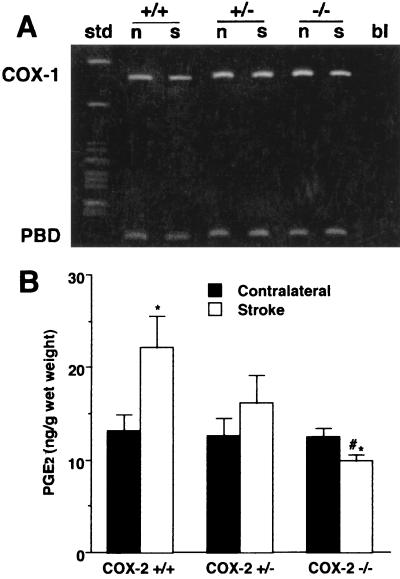
Figure 2.
COX-1 mRNA expression and PGE2 concentration in the brain of COX-2-null mice 24 h after MCA occlusion. (A) Representative gel illustrating COX-1 mRNA expression assessed by RT-PCR 24 h after MCA occlusion. Similar results were obtained in four separate groups of COX-2 +/+, +/−, and −/− mice. COX-1/PBD OD ratios in the ischemic cortex of COX-2 +/+, +/−, and −/− mice were 1.7 ± 0.4, 1.6 ± 0.2, and 1.8 ± 0.5, respectively (n = 4 per group; P > 0.05). Abbreviations are as in Fig. 1. (B) Effect of MCA occlusion on PGE2 concentration in the ischemic cortex (Stroke) and contralateral cortex. The PGE2 elevation in the ischemic cortex in COX-2 +/+ (n = 8) was attenuated in COX-2 +/− (n = 7) and abolished in COX-2 −/− mice (n = 7) (*, P < 0.05 from contralateral; #, P < 0.05 from +/+ stroke).

