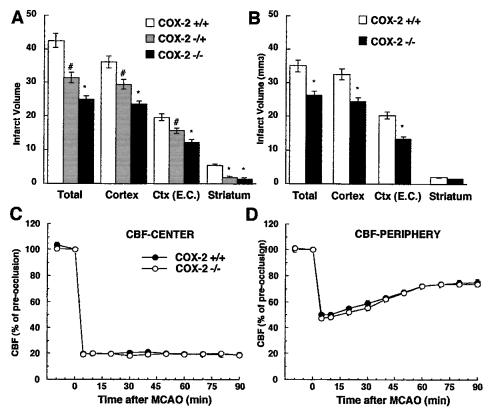
Figure 3.
(A) Infarct size in COX-2 +/+ (n = 6), +/− (n = 7), and −/− (n = 8) null mice 96 h after MCA occlusion (MCAO). Ctx (E.C.), cerebral cortical infarct corrected for swelling. (*, P < 0.05 from COX-2 +/+ and +/− mice; #, P < 0.05 from COX-2 −/− and +/+ mice). (B) Infarct size in COX-2-null mice 24 h after MCAO (n = 6 per group; *, P < 0.05 from COX-2 +/+ mice). (C and D) CBF reduction in the center (C) and periphery (D) of the ischemic region in COX-2 +/+ and −/− mice after MCAO (n = 6 per group).

