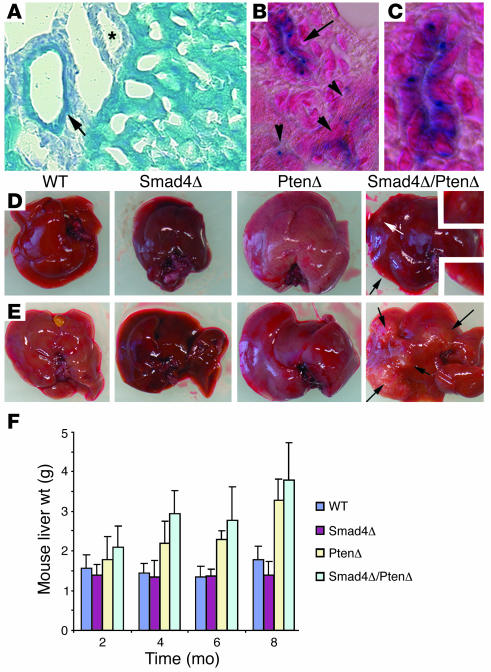
Figure 1. Targeted disruption of Smad4 and Pten results in liver cancer.
(A–C) Alb-Cre activity assayed using Rosa-26 reporter mice at P30 (A) and P15 (B and C). Arrows indicate bile ducts, arrowheads indicate hepatocytes, and the asterisk marks an artery, which is not stained. The bile duct (arrow in B) is amplified in C. Magnification: ×300 (A), ×450 (B), ×900 (C). (D and E) Tumor formation in 4-month- (D) and 8-month-old (E) Smad4Co/CoPtenCo/CoAlb-Cre mice, but not in mice of other genotypes. (F) Weights of livers isolated from mice at different ages as indicated. PtenΔ, PtenCo/CoAlb-Cre mice; Smad4Δ, Smad4Co/CoAlb-Cre mice; Smad4Δ/PtenΔ, Smad4Co/CoPtenCo/CoAlb-Cre mice.

