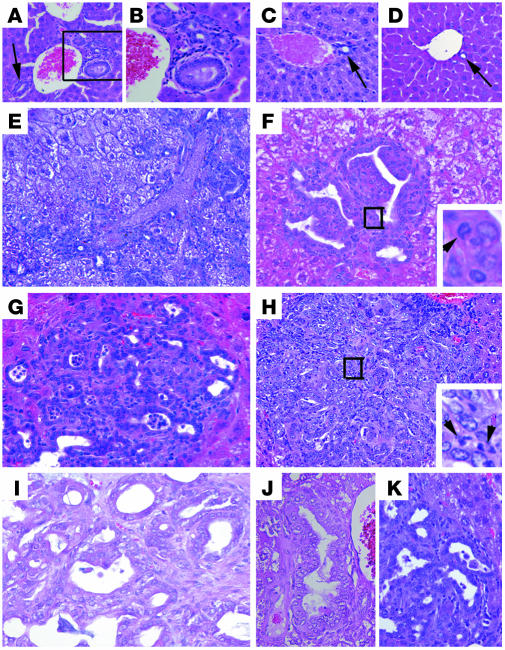
Figure 2. CC formation in Smad4Co/Co PtenCo/Co Alb-Cre mice.
(A–D) Histologic analysis of livers isolated from 2-month-old Smad4Co/CoPtenCo/CoAlb-Cre (A and B), WT (C), and Smad4Co/CoAlb-Cre (D) mice. Arrows indicate bile ducts. (E) An H&E-stained liver section showing significantly increased bile duct branching in the liver of a 3-month-old Smad4Co/CoPtenCo/CoAlb-Cre mouse. The arrow and arrowhead indicate large and small branches, respectively. (F–I) Bile duct dysplasia (F), CC foci with varying histopathology (G and H), and well-developed CC (I) found in Smad4Co/CoPtenCo/CoAlb-Cre livers. Arrowheads in the insets indicate cells at the mitotic phase. (J and K) Bile duct hyperplasia (J) and CC foci in PtenCo/CoAlb-Cre (K) livers. Magnification: ×100 (A); ×200 (B–D and H); ×400 (E–G and I–K).

