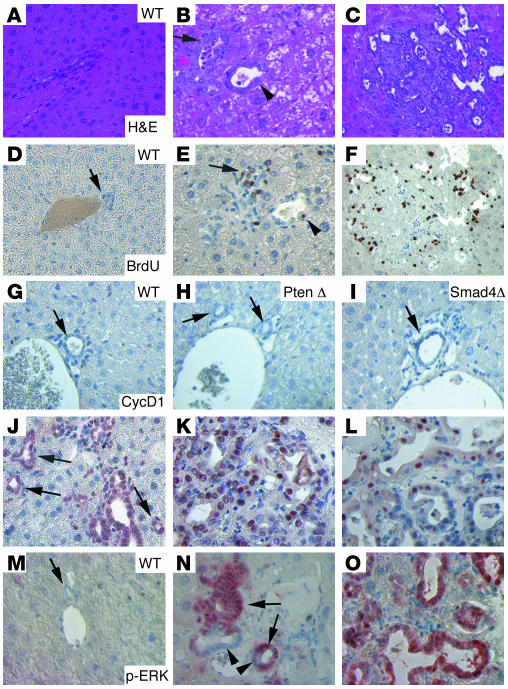
Figure 4. Molecular characterization of CCs that developed inSmad4Co/CoPtenCo/CoAlb-Cre mice.
H&E (A–C) and BrdU (D–F) images. Liver cells appeared normal in WT liver (A and D), and hyperplasic foci (B and E) and bigger tumors (C and F) developed in Smad4Co/CoPtenCo/CoAlb-Cre mice. The arrow in E indicates an area of BrdU-positive cells, and the arrowhead indicates a single BrdU-positive cell in a bile duct with moderately increased numbers of cells. Their corresponding positions are indicated in B. (G–O) Immunohistochemical staining with antibodies against cyclin D1 (CtcD1) (G–L) and p-ERK (M–O) of control liver, neoplastic foci, and bigger tumors. Arrows in J point to cyclin D1–positive bile ducts that still maintained single layers of cells. Arrowheads in N indicate p-ERK–negative cells in the single layer area of the bile duct. These cells gradually became p-ERK positive, especially when multiple layers of cells accumulated in the bile duct (arrows). Most samples were from 4-month-old mice, except for some bigger tumors (K, L, and O), which were from 8-month-old mutant mice. At least 5 samples of each genotype were used for each antibody. Unless otherwise indicated (in the upper-right corner), tumors from Smad4Co/CoPtenCo/CoAlb-Cre mice are shown. Magnification: ×500.

