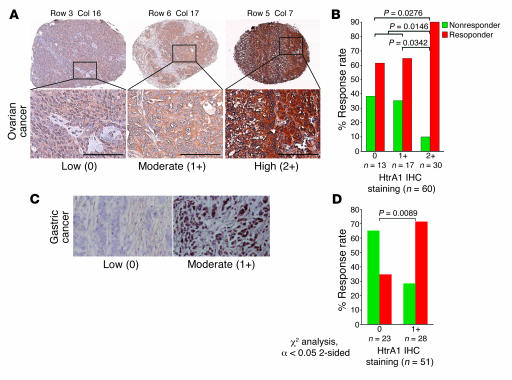
Figure 5. Expression of HtrA1 correlates with patient response to chemotherapy.
(A) Immunohistochemical analysis of HtrA1 expression in primary ovarian tumors on TMA showing low (0), moderate (1+), and high (2+) levels of HtrA1 staining. A small section of TMA with 3 representative HtrA1 expression levels is shown. Scale bars represent approximately 100 μm. (B) Univariate analysis of chemoresponse showing a significant association between HtrA1 expression and chemoresponse in ovarian cancer. (C) Immunohistochemical analysis of HtrA1 expression in primary gastric tumors showing low (0) and moderate (1+) levels of HtrA1 staining. Original magnification, ×250. (D) Univariate analysis of chemoresponse showing significant association between HtrA1 expression and chemoresponse in gastric cancer; 2-sided χ2 analysis, α = 0.05.

