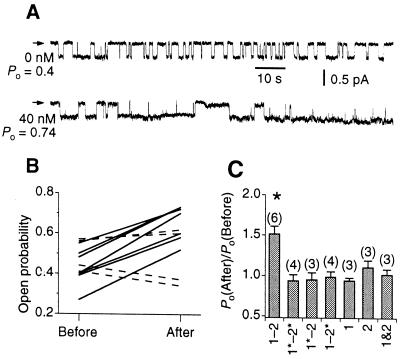
Figure 3.
Effect of NHERF PDZ-domain-mediated interactions on CFTR channel activity. (A) Single-channel current traces of CFTR before and after addition of 40 nM PDZ1–2. The closed level is indicated by arrowheads. (B) Po of CFTR before and after addition of 40 nM PDZ1–2 (solid lines) or PDZ1*–2* (dashed line). Each trace represents individual experiments. (C) Mean ratio of CFTR Po after and before addition of 40 nM of various PDZ peptides. * Indicates significant difference of Po (P < 0.01) after addition of peptide. PDZ1–2 (1–2), PDZ1*–PDZ2* (1*–2*), PDZ1*–PDZ2 (1*–2), PDZ1–PDZ2* (1–2*), PDZ1 (1), PDZ2 (2), and PDZ1 and PDZ2 mixed together (1&2) are indicated. Number of experiments indicated in parentheses.

