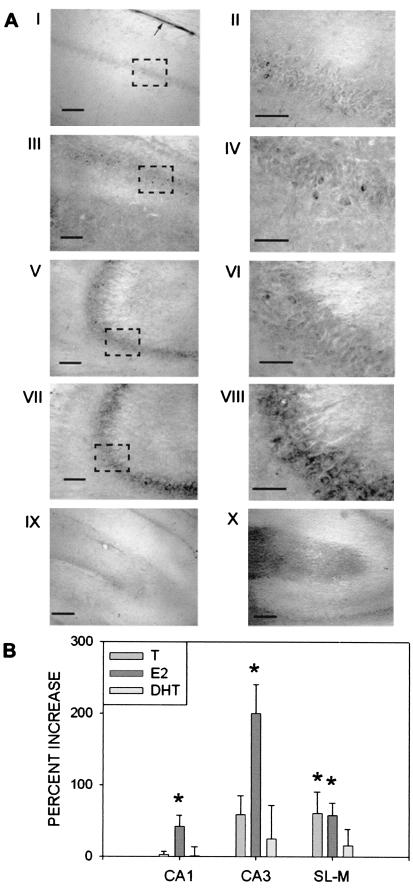
Figure 3.
Effects of steroid treatment on hippocampal N-cad protein expression. (A) Representative photomicrographs of N-cad immunoreactivity. II, IV, VI, and VIII (original magnification, ×600; bar = 50 μm) are magnifications of the boxed areas in I, III, IV, and VII (original magnification, ×200; bar = 100 μm), respectively. Low or absent staining in area CA1 (I and II) and CA3 (V and VI) was typical of vehicle-, T-, or DHT-treated castrated males. Increased staining typical of castrated males treated with E2 was observed in areas CA1 (III and IV) and CA3 (VII and VIII). IX depicts low or absent staining in the SL-M typical of vehicle or DHT-treated males (original magnification, ×100; bar = 200 μm). X depicts increased staining in the SL-M typical of castrated males treated with T or E2. Arrow in I indicates the immunopositive ependymal glia layer overlying the alveus. (B) Percentage change in relative optical density of N-cad immunoreactivity by area and steroid treatment (bars represent SEM). Increase is relative to vehicle treated castrate males. T, Castrated males treated with testosterone; E2, castrated males treated with 17β-estradiol; DHT, castrated male treated with dihydrotestosterone. CA1, CA1 pyramidal cell layer; CA3, CA3 pyramidal cell layer; SL-M, stratum lacunosum-moleculare. *, Significantly different from vehicle-treated controls as indicated by independent groups t test with α = 0.05.

