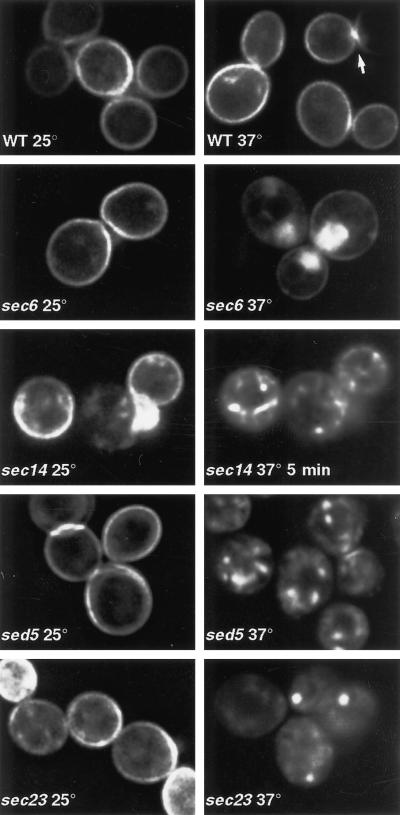
Figure 1.
GFP-Snc1p distribution in secretory mutants. Images of live cells, either wild type for secretory function (WT) or carrying the indicated mutations, are shown. The sec14 panels show the same cells imaged on a heated stage before and 5 min after temperature shift. WT, sec6, and sec23 cells were incubated for 1 h at 37°C; sed5 cells were incubated for 30 min. The arrow indicates an example of concentration of GFP-Snc1p in the bud (to the left of the arrow) relative to the mother cell (to the right).

