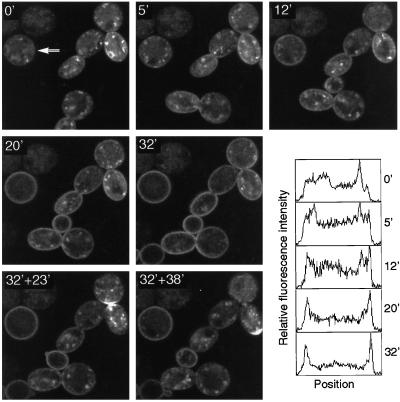
Figure 5.
Recycling of the GFP-Snc1p L96V mutant. cmd1-1 cells expressing the mutant protein were incubated on a heated stage at 28°C and imaged (0′). The temperature was then shifted to 37°C within the next 2 min, and images were taken at the indicated times (minutes) after the temperature shift. Heating was turned off at 32 min, and the cells were cooled slowly, reaching 30°C ∼10 min later. The last two images were taken 23 and 38 min after the heating was turned off. A polarized surface distribution of GFP-Snc1p can be seen at the forming septum (32′ + 23′) and at the incipient bud site (32′ + 38′) in the right cell. Fluorescence intensity profiles from a 12-pixel-wide horizontal strip across one cell, as indicated by the arrow (0′), are shown for each time point. These are normalized plots, which show the relative distribution of fluorescence across the cell, not absolute values. Some movement of cells on the slide occurred, and this accounts for the appearance of additional cells at 12 and 32 min.

