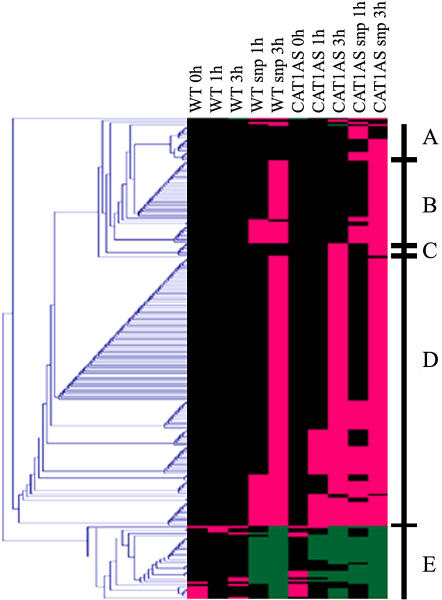
Figure 3.
Cluster analysis of genes modulated by NO and/or H2O2. Hierarchical clustering of cDNA-AFLP differentially expressed transcript tags in control and catalase-deficient tobacco plants after SNP or water infiltration during the HL time course (0, 1, and 3 h) is shown. A fold change of 0.5 was fixed to discriminate significant expression changes from the signal background. All expression differences <50% were set to 0. Those higher than the fixed threshold were set to 1 and −1 for positive and negative expression changes, respectively. Magenta and green correspond to up-regulation and down-regulation, respectively, and black indicates time points when no relevant change in transcript level was measured. Prominent clusters A to E are indicated in the figure. For details, see “Materials and Methods.”

