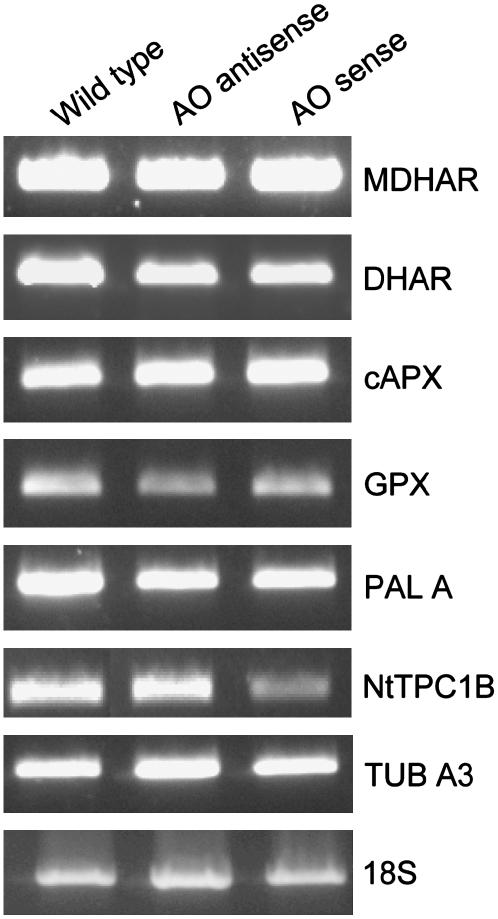
Figure 6.
Relative abundance of transcripts encoding a selection of antioxidant enzymes and the ion channel NtTPC1B. Transcript abundance was measured by semiquantitative RT-PCR in leaves from untransformed controls (wild type), AO sense, and AO antisense lines: Transcripts include MDHAR, DHAR, cytosolic ascorbate peroxidase (cAPX1), GPX, PAL, ion channel NtTPC1B, tubulin, and 18S (controls).

