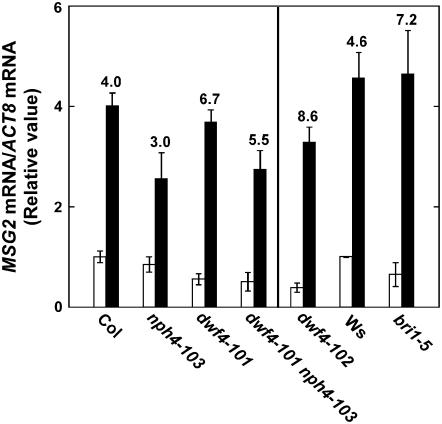
Figure 6.
RT-PCR analyses of MSG2 gene expression with (black bar) or without (white bar) IAA treatment at 10 μm for 1 h. Induction ratio (fold) by the IAA treatment is written above each set of bars. mRNA level of MSG2 normalized against the ACTIN8 mRNA level is expressed as a ratio to that of wild type (Col and Ws on the left and right, respectively). Each value represents the mean ± sd of three experiments using independently prepared total RNA samples. Seedlings were grown in liquid one-half-strength Murashige and Skoog medium in the dark for 4 d before IAA treatment.

