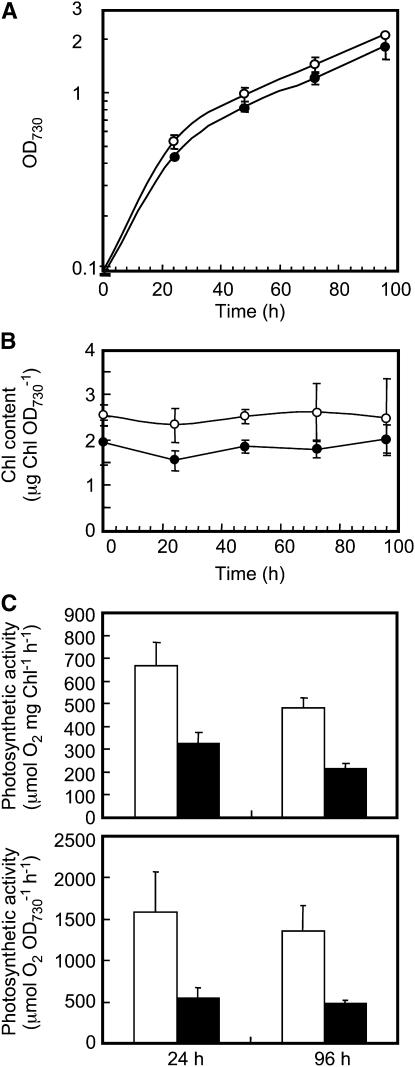
Figure 3.
Growth profiles, Chl a content, and the rates of photosynthesis in wild-type and Δ1848 Δ2060 cells. A, Growth of the wild-type (white circles) and Δ1848 Δ2060 (black circles) cells at a photon flux density of 50 to 80 μmol m−2 s−1. B, Changes in the content of Chl a after the inoculation of new medium with wild-type (white circles) and Δ1848 Δ2060 (black circles) cells. C, The rate of photosynthesis per Chl a (top section) and per OD730 (bottom section) in wild-type (white columns) and Δ1848 Δ2060 (black columns) cells, as measured with an oxygen electrode at a photon flux density of 1,500 μmol m−2 s−1 at 30°C. Each value represents an average of three independent experiments. Bars indicate sd.

