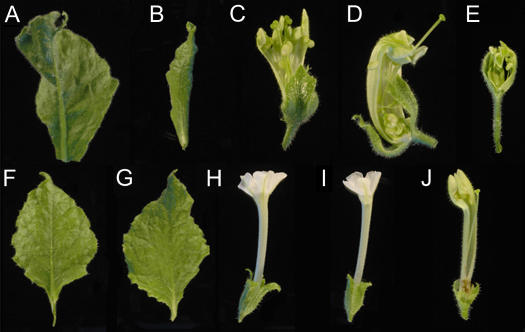
Figure 4.
Developmental abnormalities associated with VIGS of NbAGO1. Representative leaves (A and B) and flowers (C–E) of plants infected with TRV:NbAGO1-1. Representative leaf (F) and flowers (H and J) of plants infected with TRV:00 and leaf (G) and flower (I) of plants infected with TRV:NbAGO4-1. No phenotypic differences were observed between plants infected with TRV:00 or TRV:NbAGO4 and identical abnormalities were observed in plants infected with TRV:NbAGO1-1 or TRV:NbAGO1-2.

