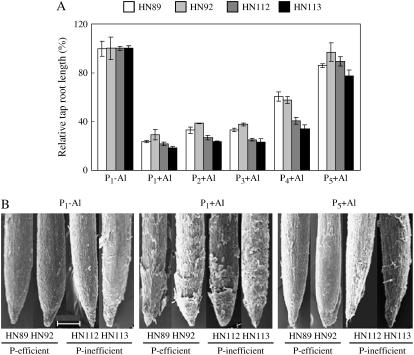
Figure 2.
Soybean root growth as affected by different P concentrations in the homogenous nutrient solution. A, Relative taproot growth in response to Al exposure. Five P concentrations were used, where P1, P2, P3, P4, and P5 are 0, 20, 40, 80, and 320 μm P, respectively, added as KH2PO4, and an Al3+ activity of 38 μm (as AlCl3) was used (see “Materials and Methods” for details). B, Scanning electron micrograph showing the effect of Al and P interactions on the morphology of the root apex (scale bar = 200 μm).

