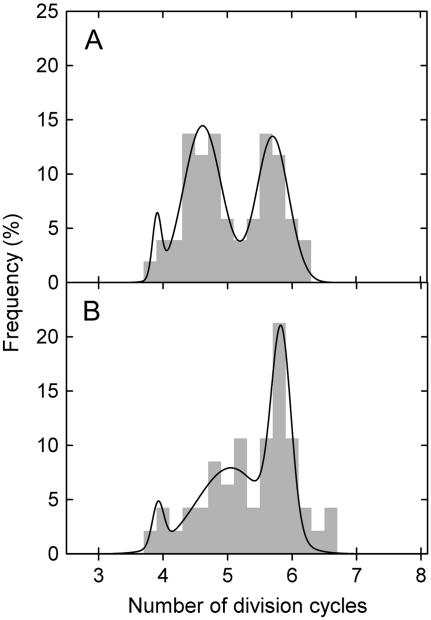
Figure 3.
Frequency distribution of cell files with different numbers of division cycles. L. perenne plants were grown for 47 d at high (1 mm; A) and 61 d at low (0.02 mm; B) phosphorus supply. For the analysis, data for eight to 10 cell files of each of the six plants per treatment were combined. In every file, the number of division cycles of the progeny of the cell formed by the division of the initial cell at the base of the meristem was calculated as log2 (number of cells in the meristem; Eq. 10). Triple Gaussian normal distribution curves best fitted the frequency distributions (r2 = 0.95 for high-phosphorus plants; r2 = 0.91 for low-phosphorus plants), with peaks located at 3.9 ± 3.46, 4.6 ± 0.03, and 5.7 ± 0.03 divisions per cell (high phosphorus), and 3.9 ± 0.38, 5.1 ± 0.15, and 5.8 ± 0.02 divisions per cell (low phosphorus).

