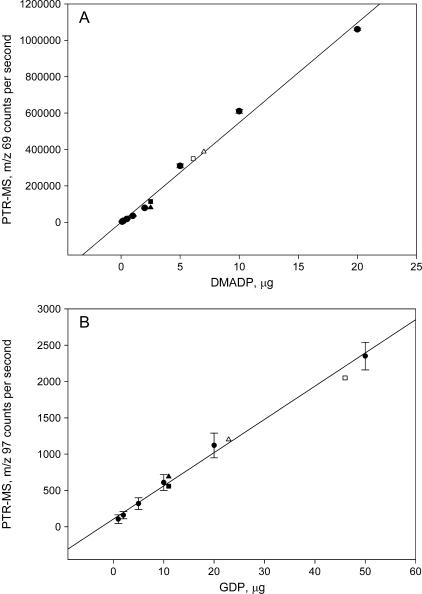
Figure 1.
Correlation between the concentration of DMADP (A) and GDP (B) standards subjected to acid hydrolysis and the evolved isoprene and linalool, respectively. Isoprenoid concentration was measured by PTR-MS, and the counts per second for the protonated mass of isoprene (m/z 69) and linalool most abundant fragment (m/z 97) are shown as mean ± se (black circles, n = 4). When not visible, ses are lower than symbol size. Triangles and squares represent two experiments in which 2.5 μg of DMADP and 11 μg of GDP were added to leaf extract of Q. ilex and P. alba, respectively, to determine whether the leaf characteristics could influence the yields of these compounds. White symbols show results with illuminated leaves whose endogenous pools of DMADP and GDP were previously determined and subtracted from the amount of DMADP and GDP exogenously supplied. Black symbols show results with darkened leaves whose endogenous pools of DMADP and GDP were depleted.

