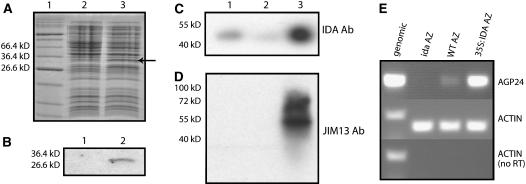
Figure 5.
IDA and AGP Expression in AZs.
(A) Coomassie blue–stained SDS-PAGE gel of proteins from E. coli cultures harboring a GST:IDA fusion construct, with and without induction with isopropylthio-β-galactoside (lanes 2 and 3, respectively). The induced fusion protein is indicated by an arrow. The sizes of relevant markers of the protein standard (lane 1) are shown at left.
(B) Detection of the GST-IDA fusion protein by protein gel blot analysis of proteins from uninduced (lane 1) or induced (lane 2) E. coli cells using the IDA antibody.
(C) Protein gel blot analysis of 200 μg of protein isolated from AZ tissue of wild-type (lane 1), ida mutant (lane 2), and 35S:IDA (lane 3) plants using the IDA antibody (Ab). Size markers are shown at left.
(D) The same membrane as in (C) probed with JIM13.
(E) RT-PCR analysis with AGP24 primers of cDNA derived from AZs of ida, wild-type (ecotype C24), and 35S:IDA plants, as indicated. Actin primers were used for positive and negative controls with both genomic DNA and cDNA.

