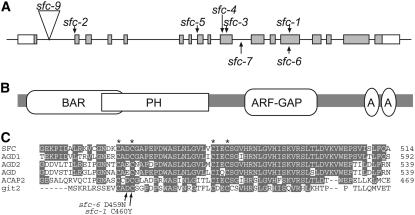
Figure 2.
SFC Molecular Characterization.
(A) Diagram of the SFC gene structure and positions of mutations. The 5′ end of this gene is at the left. Boxes indicate exons, gray portions of boxes correspond to translated regions, and white boxes are untranslated regions. Lines indicate either introns or 5′ and 3′ regions.
(B) Illustration of SFC domain organization. A, Ankyrin domain.
(C) Alignment of AGDs. The four critical Cys residues are indicated by an asterisk above the SFC amino acid sequence. Alignment includes the three Arabidopsis SFC-related ARF-GAP proteins, the human ACAP2 (centaurin β2), and a more distantly related mammalian GIT2 ARF-GAP. The changes in sfc missense mutations are shown below the alignment.

