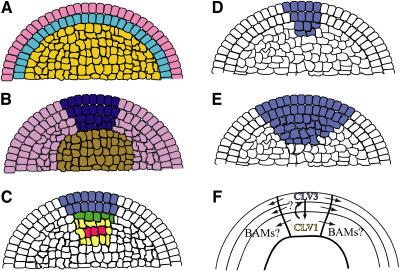
Figure 1.
Models for SAM Organization and Maintenance.
(A) Tunica corpus model for SAM structure. L1, pink; L2, light blue; L3, orange.
(B) Zonal model for SAM structure. CZ, dark blue; PZ, purple; rib zone, brown.
(C) Expression pattern of CLV pathway genes. CLV1 expression, yellow; CLV3 expression, blue; CLV3/CLV1 overlap, green; WUS expression, red.
(D) CLV3 expression domain (blue) in the wild type. Note similarity of CLV3 expression to CZ in (B).
(E) CLV3 expression in clv3 mutant background.
(F) Composite of SAM layers and zones. Arrows indicate direction of signaling between SAM regions based on experiments described in the text.

