Figure 4.

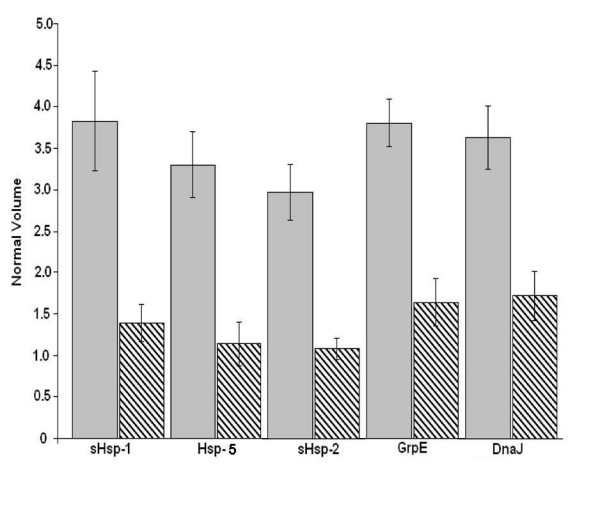
Quantative analysis of heat shock proteins differentially expressed at 42 °C (patterned columns), and 49 °C (shaded columns).

Quantative analysis of heat shock proteins differentially expressed at 42 °C (patterned columns), and 49 °C (shaded columns).