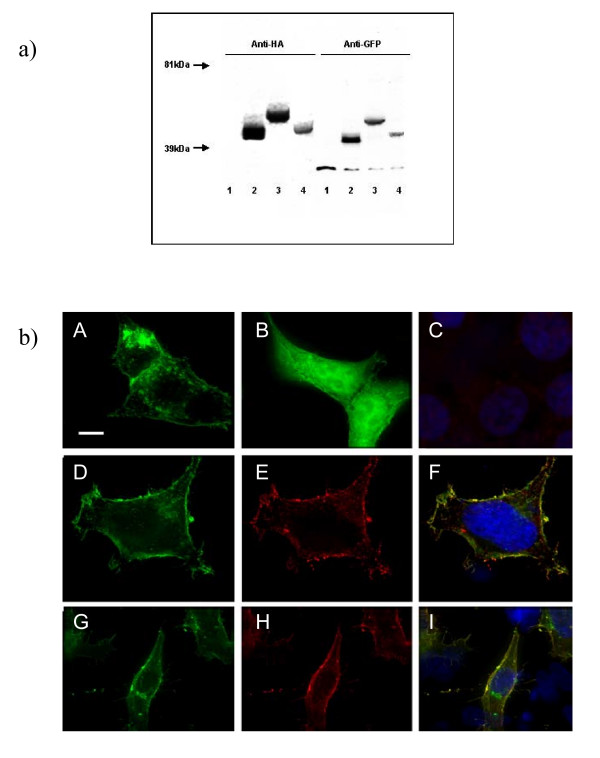
Figure 2.

a) pIN-G and fusion protein constructs yield proteins of the anticipated sizes following expression in HEK293 cells. Detection of pIN-G protein (lane 2) through immunoblotting (see Methods) with antibodies against HA and GFP reveals a protein of 41 kDA. Lanes 3 and 4 correspond to pIN-G fusion proteins bearing the carboxy terminus of the Kv1.4 potassium channel (pIN-JHE811) or TGN38 trans-Golgi Network targeting motif (pIN-TGN38), respectively. Lane 1 corresponds to mock-transfected cells. b) Total and surface expression of pIN-G in transfected HEK293 cells determined through fluorescence imaging. HEK293 cells transiently transfected with pIN-G (A) or EGFP (B) were fixed and viewed with a 100× objective using a DeltaVision workstation (Methods) (Panel C denotes background fluorescence of mock-transfected cells upon omission of primary antibody). Panels D-I, denote total (D and G) versus surface (E and H) expression of pIN-G determined through treatment of non-permeabilised pIN-G-transfected cells with antibodies to EGFP (E), and HA (H), followed by fixation and labeling with the appropriate Cy3-conjugated secondary antibody. Panels F and I indicate merged images. Green: pIN-G fluorescence; blue: DAPI (nuclei); red Cy3 2° antibody. Areas of red/green overlap are shown in yellow. Scale bars correspond to 15 μM.
