
Figure 1.
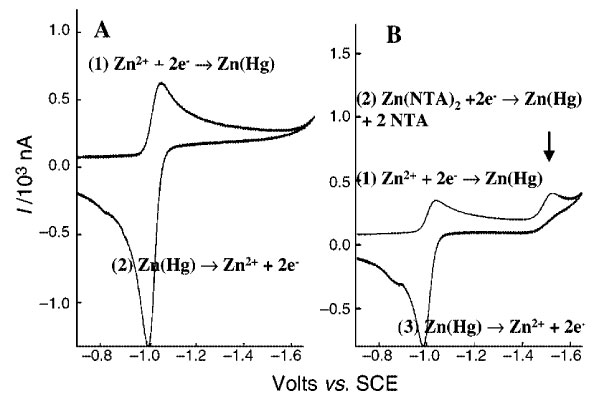
Cyclic voltammograms of (A) 100 μM inorganic Zn in seawater and (B) 100 μM Zn with 50 μM NTA. Peak 2 is due to the reduction of Zn in ZnNTA2. Peak 1 in each CV is due to inorganic Zn reduction and peak 3 is due to the oxidation of Zn in the amalgam.