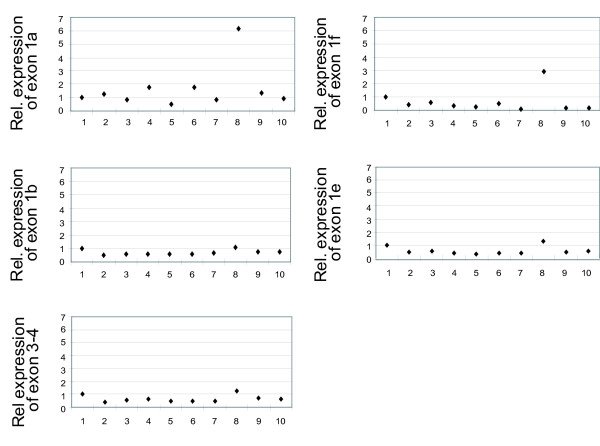
Figure 5.
Relative expression levels of the alternative first exons of CD36 in 10 monocyte samples Relative expression levels of the alternative first exons 1a, 1b, 1e, 1f and exon 3–4 in monocytes samples from 10 individuals. Expression levels of the target exons were normalized to expression levels of RPLP0, and samples were calibrated to the expression level in monocyte sample "1".

