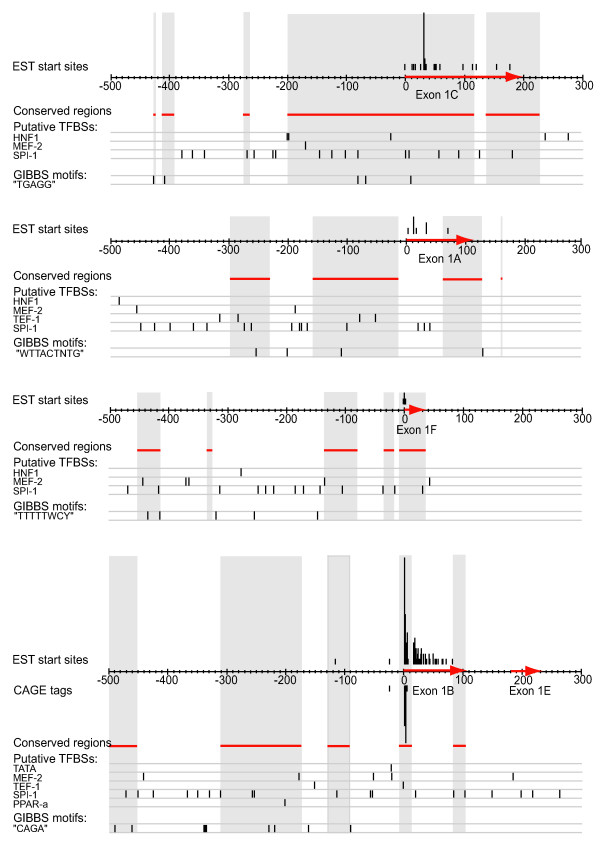
Figure 7.
Summary of the in silico promoter analysis of the alternative first exons of CD36 The x-axes of the figure correspond to the genomic regions from 500 bases upstream to 100 bases downstream of each alternative first exon. Since exon 1e starts only 180 base pairs downstream of exon 1b these two exons are shown on the same genomic sequence. The alternative first exons have been marked out with red arrows on the sequence axes. Tracks from the in silico promoter analysis have been aligned to the sequence axes: Start positions of all GenBank EST sequences have been indicated above the sequences, and the heights of the bars correspond to the number of EST sequences starting at the position. CAGE clusters corresponding to transcription start sites have been marked out below the sequences, and the height of each bar corresponds to the number of CAGE tags in the cluster at the position. Genomic regions conserved in human and mouse have been indicated with red lines below the sequences, and highlighted in grey. Putative binding sites for the transcription factors TATA binding protein, MEF-2, TEF-1, SPI-1, PPAR-α and HNF-1, as well as over-represented motifs detected with Gibbs sampler have been marked out below the sequences.

