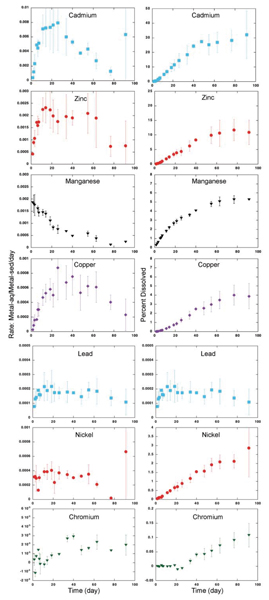
Figure 6.

Oxidation rates of reduced sediments (SC4-11) in seawater plotted as the metal concentration dissolved per day normalized to the remaining metal concentration in the sediment (right side) and as the total metal concentration dissolved normalized to the initial metal concentration in the sediment (left side).
