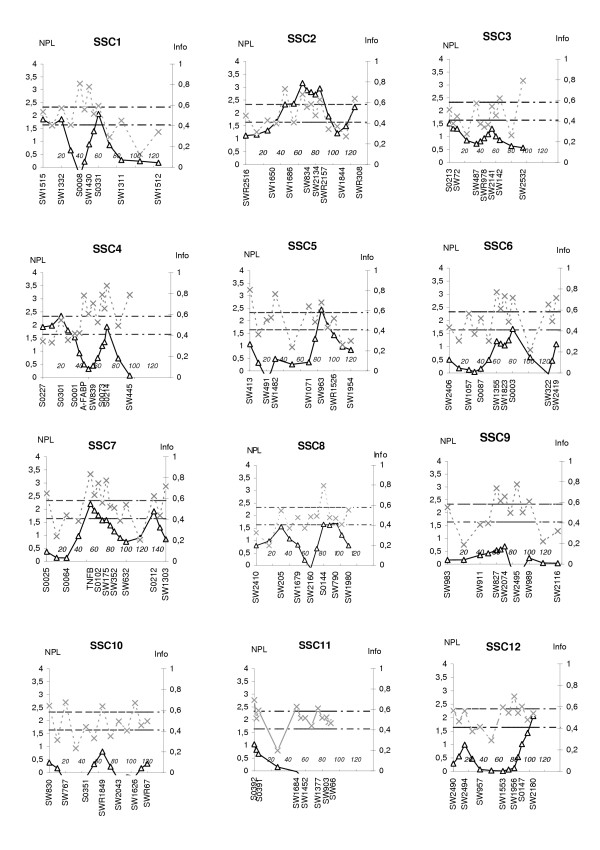
Figure 1.
Linkage results of the total genome scan for inguinal and scrotal hernias, showing sus scrofa chromosomes (SSC) 1 to 12. The bold line shows multipoint NPL score (scale on left) while the dotted line shows the information content (scale on right) for each chromosome. The threshold values P = 0.05 and P = 0.01 are shown as horizontal lines at NPL = 1.64 and NPL = 2.33, respectively. Marker positions and names are shown on the X axis.

