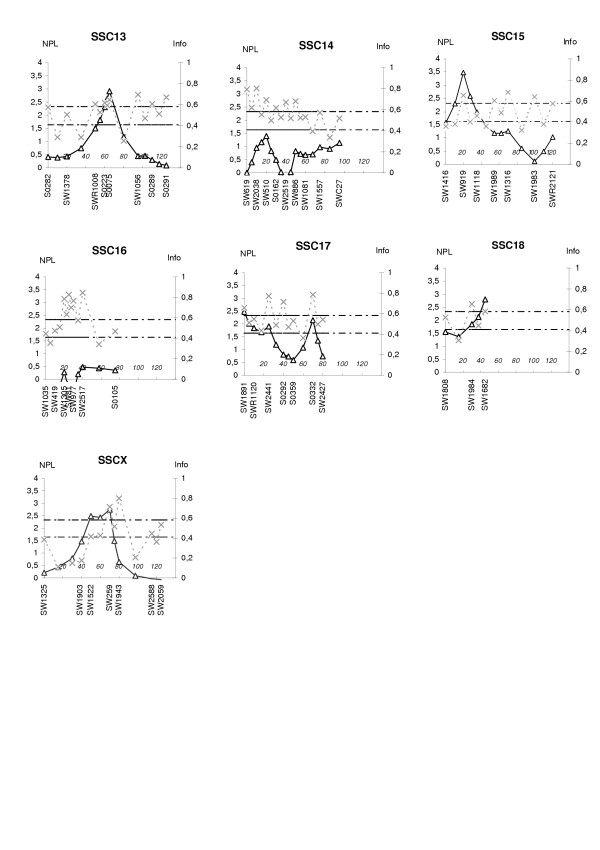
Figure 2.
Linkage results of the total genome scan for inguinal and scrotal hernias, showing sus scrofa chromosomes (SSC) 13 to X. The bold line shows multipoint NPL score (scale on left) while the dotted line shows the information content (scale on right) for each chromosome. The threshold values P = 0.05 and P = 0.01 are shown as horizontal lines at NPL = 1.64 and NPL = 2.33, respectively. Marker positions and names are shown on the X axis.

