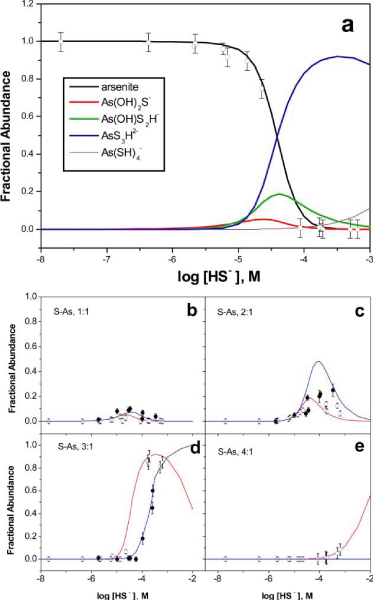
Figure 3.

(a) Distribution of arsenite and thioarsenite species at pH 7 as a function of the concentration of bisulfide based on the formation constants determined in this study (Table 4). Data points correspond to the measured fractional abundance of arsenite at pH 7 (open circles). (b)-(e) Modeled distribution (pH 7, red curves; pH 10, blue curves) and measured fractional abundances of S : As 1 : 1,2 : 1,3 : 1, and 4 : 1 species at pH 7 (open circles) and pH 10 (filled circles). Standard errors show uncertainty in the fractional abundance of arsenic species.
