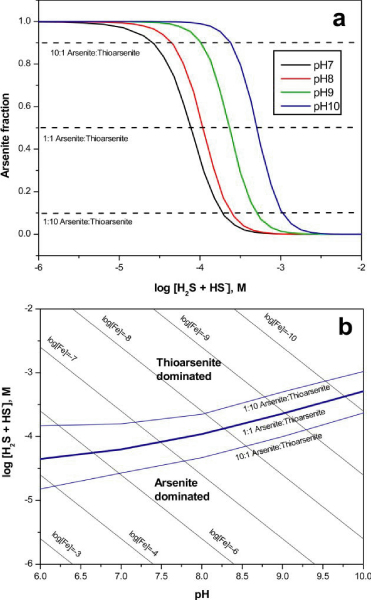
Figure 5.

(a) Modeled fractional abundance of arsenite relative to thioarsenite species as a function of pH and sulfide concentration based on formation constants determined in this study (Table 4). (b) Predominance area diagram for aqueous arsenic species. The contours represent the activity of ferrous iron in equilibrium with mackinawite (FeS) at 25°C.
