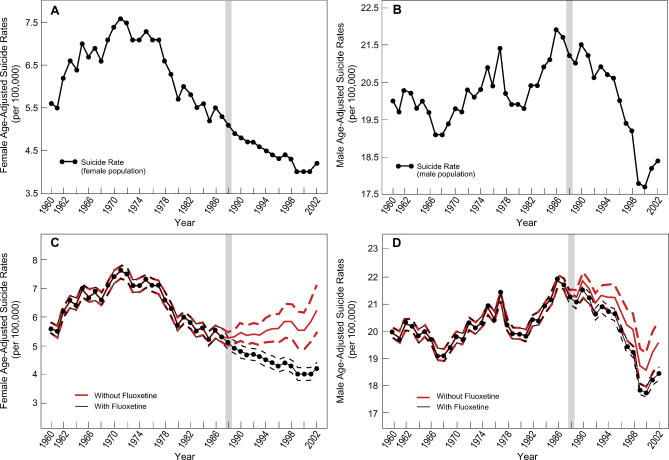
Figure 2. Age-Adjusted Suicide Rates by Sex.
(A and B) Suicide rates (per 100,000) for the total female (A) and male (B) populations from 1960–2002.
(C and D) Age-adjusted suicide rate predictions for the female (C) and male (D) populations. Solid lines trace out the posterior median model predictions and the dashed lines depict the 95% Bayesian credible intervals. The top red line depicts the predicted suicide rates without fluoxetine and the bottom black line represents the current rates with fluoxetine.

