
Figure 2.
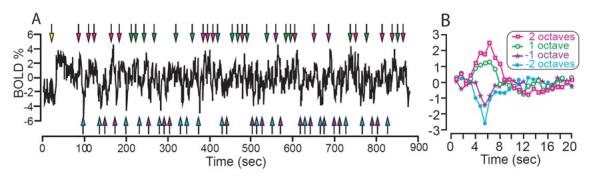
Example timecourse from a single voxel in retinotopically defined V1. A) BOLD response as a function of time from the start of experiment. Yellow arrow marks the time at which the adaptation stimulus was first presented. Green and magenta arrows indicate times at which test contrasts 1 or 2 octaves above the adaptation contrast were presented. Purple and blue arrows mark test contrast presentations 1 or 2 octaves below the adaptation contrast. 0% BOLD is set to the mean level after the 60 sec adaptation period. B) Deconvolved response to each stimulus contrast as a function of time from the beginning of the presentation of each stimulus contrast.