
Fig. 3.
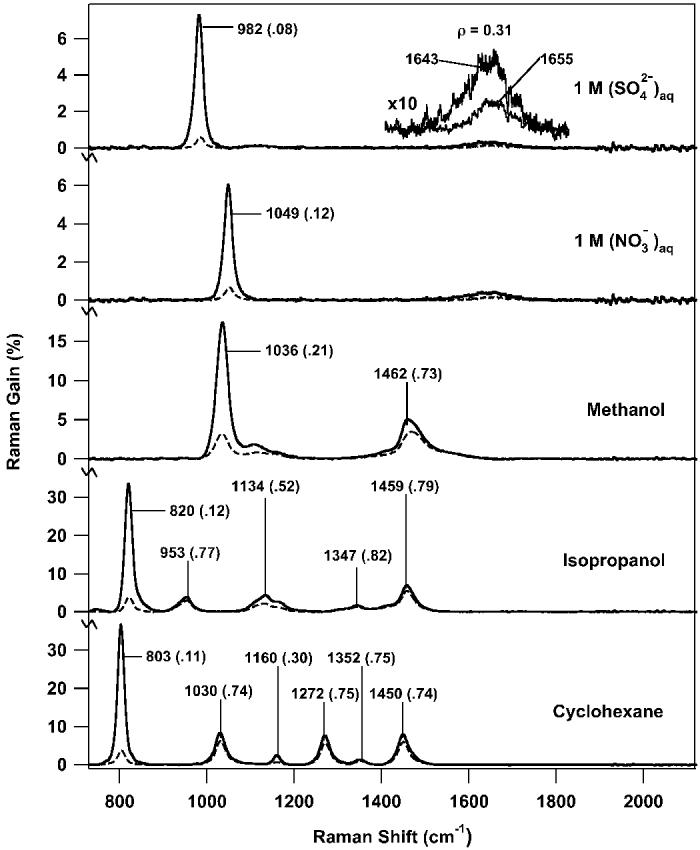
Parallel (solid) and perpendicular (dashed) FSRS spectra of 1.0 M aqueous nitrate and sulfate solutions and several common solvents. The major peak frequencies are noted with the depolarization ratio (ρ = ⊥/∥) in parenthesis. In each spectrum the Raman pump pulse energy was 1.5 μJ/pulse. The aqueous solution spectra are the average of fifty 100-ms Raman gain spectra with a 1-cm-pathlength cell (total acquisition time: 11 s). The methanol and isopropanol spectra are averages of ten 100-ms Raman gain spectra with a 1-cm-pathlength cell (total acquisition time: 2.2 s). The cyclohexane spectrum is an average of ten 100-ms Raman gain spectra with a 3.5-mm-pathlength cell (total acquisition time: 2.2 s). The inset presents a blow up (10×) of the Raman feature due to the water bending mode. The non-coincidence between the parallel and perpendicular water bend frequencies is due to changing degrees of cross-phase modulation.