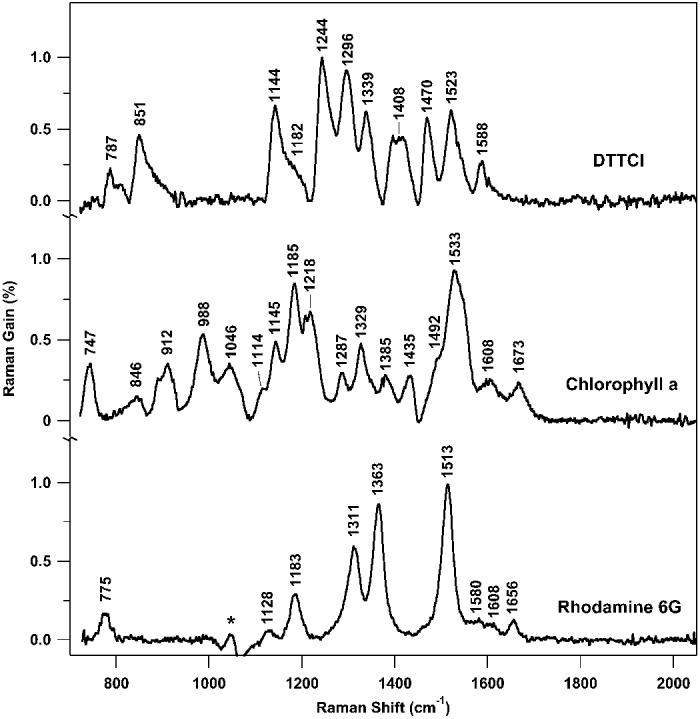
Fig. 6.

Parallel FSRS Raman spectra of DTTCI (2 μM in methanol), chlorophyll a (0.6 mM in ethanol), and rhodamine 6G (1.3 mM in methanol). In each case the solvent peaks have been subtracted. An artifact of the methanol subtraction (*) remains in the rhodamine 6G spectrum. Experimental conditions: Raman pump pulse energy = 1.5 μJ/pulse; pathlength = 1 cm; data acquisition time = 2.2 s for DTTCI and 11 s for chlorophyll a and rhodamine 6G.
