Figure 2.
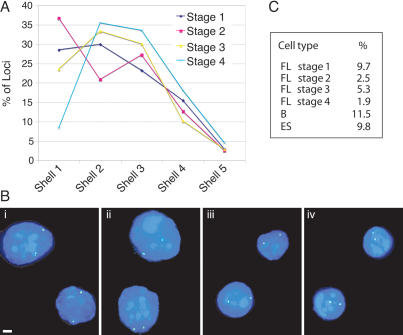
Nuclear location of the β-globin locus. (A) Distribution of the β-globin loci among five concentric shells at the different maturation stages as assayed by DNA FISH (each shell encompasses 20% of the nuclear radius, shell 1 representing the periphery and shell 5 the center of the nucleus). Image stacks of formaldehyde-fixed cells were collapsed onto a single plane and analyzed in 2D. Between 150 and 300 loci were scored for each cell population. (B, panels i–iv) Examples of β-globin locus position at the sorted maturation stages 1–4 by DNA FISH. The β-globin locus probe is stained green; nuclear DNA is counterstained blue with DAPI. Bars, 2 μm. (C) Association of the β-globin locus with PCH by DNA FISH. Nuclear volumes were reconstructed and rotated in 3D, and colocalization of the β-globin locus probe with γ-satellite repeat probe scored. All four fetal liver stages and splenic B cells and ES cells were analyzed.

