Figure 3.
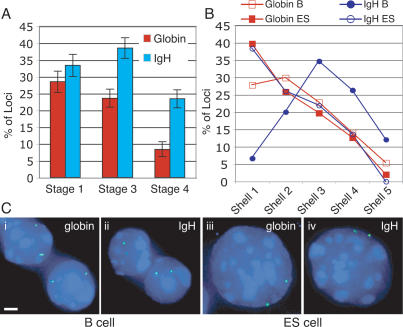
Location of the β-globin and IgH loci is gene and tissue specific. (A) The nuclear position of the IgH and β-globin loci was compared at three different erythroid maturation stages by DNA FISH. Shown are only the frequencies of peripheral loci within 20% of the nuclear radius from the envelope (red bars indicate β-globin, blue bars indicate IgH locus, and error bars indicate SE). (B) Comparison of the nuclear positions of the β-globin and IgH loci in B and ES cells. The graph shows the distribution of the gene loci among five concentric shells in B- and ES-cell nuclei (each shell encompasses 20% of the nuclear radius, shell 1 representing the periphery and shell 5 the center of the nucleus; red open squares indicate β-globin locus in B cells, red closed squares indicate β-globin locus in ES cells, blue closed circles indicate IgH locus in B cells, and blue open circles indicate IgH locus in ES cells). (C) Examples of β-globin and IgH locus position in B and ES cells by DNA FISH. The locus probes are green; nuclear DNA is counterstained blue with DAPI. Bars, 2 μm.

