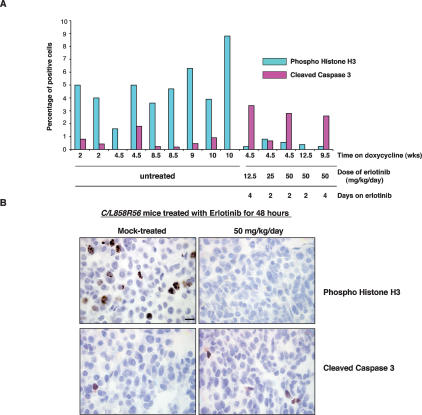
Figure 8.
Decreased mitoses and increased apoptosis upon effective erlotinib treatment. (A) Quantification of phosphohistone H3 and cleaved caspase 3 in untreated and erlotinib-treated mice. (B) Phosphohistone H3 (top) and cleaved caspase 3 (bottom) staining of lung sections from untreated and erlotinib-treated C/L858R56 mice is shown. Bar, 10 μm.

