
FIGURE 5. Binding parameters for isolated αL I domains.
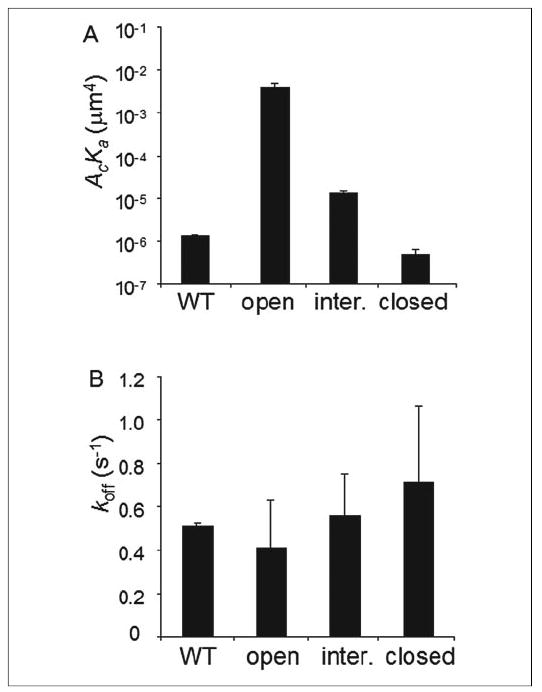
The effective binding affinities (A) and off-rates (B) of the WT, locked open, locked intermediate (inter.), and locked closed I domains for ICAM-1 are shown. Two or three specific binding curves were measured for each I domain species, and Equation 1 was fit to each curve to evaluate an effective binding affinity and an off-rate for that curve. Binding parameters estimated from different curves for the same species were averaged and calculated for standard deviation as presented in the figure. All differences in AcKa values of different I domains are statistically significant (p < 0.02, Student’s t test) except that between the WT and locked closed I domains (p > 0.06). None of the differences in koff values of different I domains are statistically significant (p > 0.16).