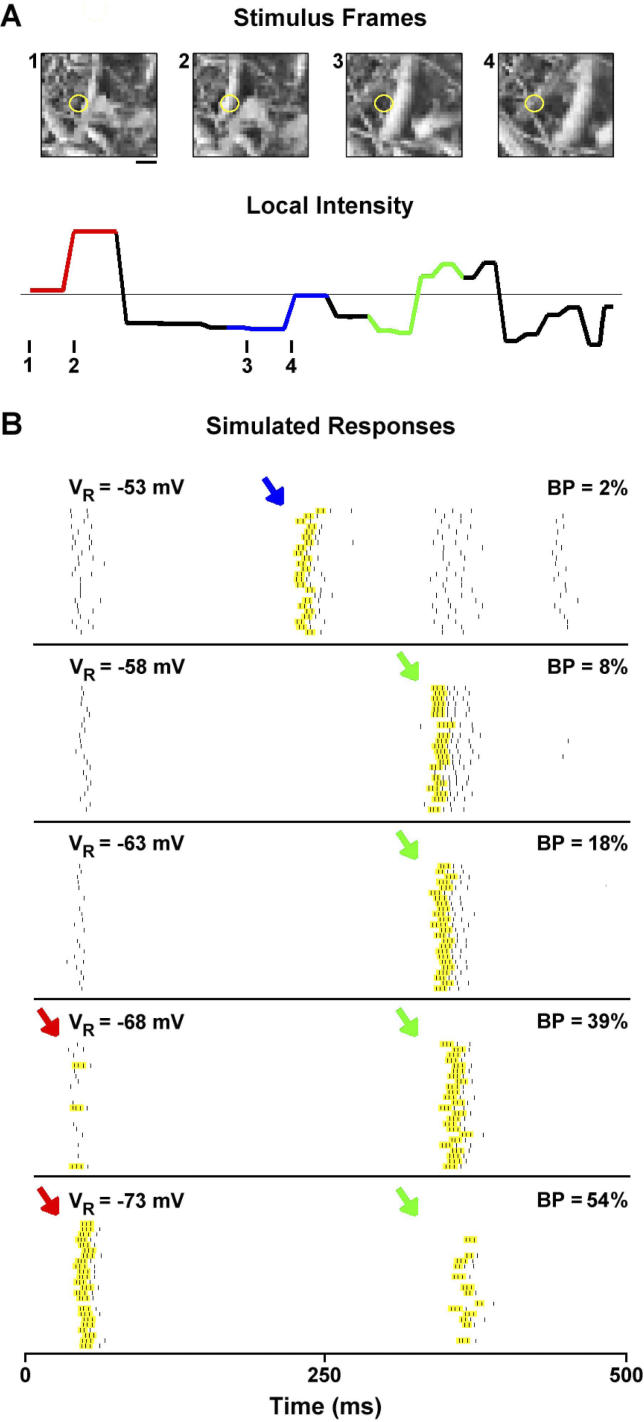
Figure 1. Simulated LGN Responses to Natural Scene Movies at Different Resting Potentials.
(A) Four frames of a natural scene movie are shown. Movies were recorded by a camera mounted on the head of a freely roaming cat [ 23]. The RF center of the simulated neuron is indicated by the yellow circle. The scale bar indicates 1°. The intensity of a 500-ms segment of the movie averaged over all pixels in the RF center is also shown. The thin gray line indicates the mean intensity. The tick marks on the intensity plot indicate the onset times of the corresponding frames. Three stimulus events are colored to correspond to burst events in the responses in (B).
(B) Raster plots of simulated LGN responses to 24 repeats of the 500-ms segment of a natural scene movie shown in (A). Burst events in the responses are highlighted. The colored arrows next to each burst event correspond to the luminance sequences in (A). Responses were simulated using an IFB model. The resting potential of the model ( V R) and BP of the simulated response to a two-minute segment of natural scene movie that includes the 500-ms segment shown are indicated. The de-inactivation potential and threshold of the burst mechanism ( V T) was −60 mV. For values of other model parameters, see Materials and Methods.

