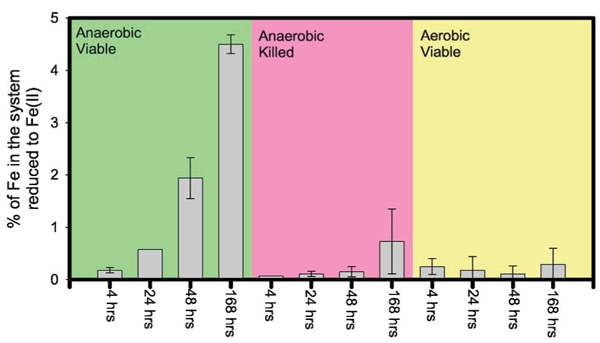
Figure 2.

(Color) The percentage of Fe in each system of Experiment 2 that was in the reduced Fe(II) form. Note that most of the Fe(II) was partitioned into the solid phases. The mean and standard deviation of duplicate runs under each condition are shown.
