Figure 4.

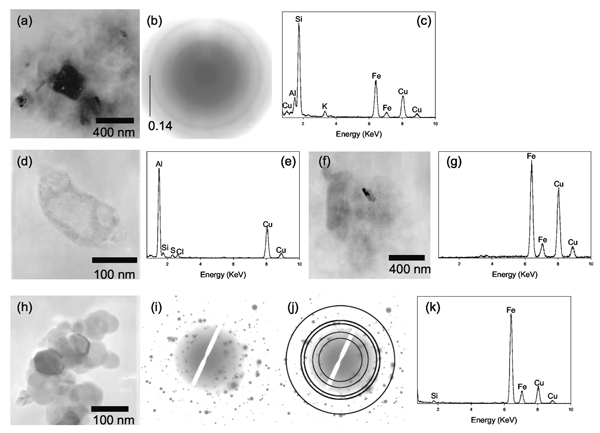
(a) TEM bright field image of a poorly crystalline aggregate found in the product of 4 hours, anaerobic incubation with viable DIRB. (b) SAED pattern of the aggregate indicates that the particles in this aggregate are poorly crystalline. (c) EDXS spectrum of the aggregate shows that the aggregate is primarily composed of Si, Al, Fe, and K. (d) TEM bright field image of a bacterial cell found in the 24 hours, anaerobic incubation with viable DIRB. (e) EDXS spectrum of the bacterial cell reveals a strong Al signal, indicating that the cell is heavily encrusted with Al, perhaps due to adsorption. (f) TEM bright field image of a particulate organic matter (possibly an EPS) associated with an amorphous solid. (g) EDXS spectrum of the amorphous solid indicates that it is rich in Fe. (h) TEM bright field image of a cluster of nanosized grains with a hexagonal habit found in the 24 hours anaerobic incubation with viable DIRB. (i) SAED pattern for the cluster consists of a series of discrete diffraction spots. (j) The SAED pattern is overlaid with a set of expected powder diffraction rings for siderite (JCPDS Card 8–133). The diffraction rings correspond to the d-spacing values (and hkl indices) of 3.59 (012), 2.79 (104), 2.13 (113), 1.96 (202), and 1.43 (214). (k) EDXS spectrum from this cluster shows that the cluster is composed predominantly of Fe. Note that the EDXS signals from light elements such as carbon and oxygen are not shown because they appear in the region with high background signals, and also they are abundant in the sample mounting material.
