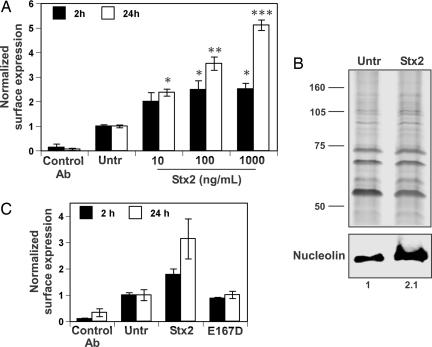
Fig. 4.
Quantification of nucleolin surface expression on epithelial cells after exposure to Stx2 or Stx2 toxoid. (A) HEp-2 cells were treated with or without Stx2 at indicated concentrations for 2 (■) or 24 (□) h. Surface-expressed proteins were labeled with monoclonal isotype-matched control or a nucleolin-specific antibody. The results were normalized by expressing values corresponding to all sample groups relative to untreated cells. Data presented are arithmetic means ± SE from a representative experiment with samples performed in triplicate. Asterisks above Stx2-treated sample groups indicate statistical difference in the 95% confidence interval from the untreated control within a time series established by independent sample t tests; sample groups with an equivalent number of asterisks are not significantly different from each other. (B) HEp-2 cells were untreated (Untr) or treated with 100 ng/ml Stx2 for 2 h. Membrane-associated proteins were extracted in detachment buffer that contained 1 M NaCl for 2 min on ice. Membrane-associated proteins were separated by SDS/PAGE and stained with silver (Upper) or subjected to immunoblotting with nucleolin-specific mAb (Lower). Immunolabeled band densities expressed relative to the untreated control were quantified with image j software. (C) HEp-2 cells were treated with or without Stx2-6H or the E167D mutated derivative (100 ng/ml) for 2 or 24 h, and surface-expressed proteins were labeled with monoclonal isotype-matched control or a nucleolin-specific antibody. Data are presented as in A.

