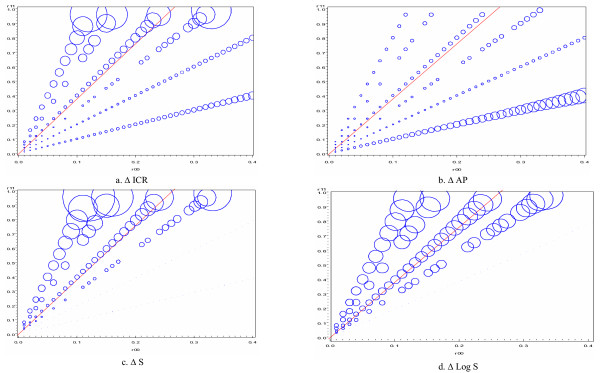
Figure 4.
Discrepancy between ICR, AP, S and logS calculatedusing the RR and the OR for different values of R11 and R00. The size of each bubble is directly proportional to the absolute difference in the interaction measures calculated using odds ratios and risk ratios at each value of R11 and R00. The line in each plot represents the set of R11 and R00 scenarios in which there is exact additivity (ICR = AP = 0; S = 1).

