
Fig 1.
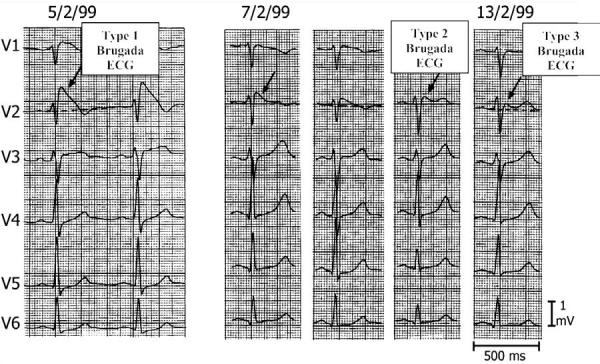
Three types of ST segment elevation generally observed in patients with the Brugada syndrome. Shown are precordial leads recorded from a patient diagnosed with the Brugada syndrome. Note the dynamic ECG changes occurring over a period of 2 days. The left panel shows a clear Type 1 ECG, which is diagnostic of the Brugada syndrome. A saddleback ST segment elevation (Type 2) was observed on 2-7-99. The ST segment is further normalized on 2-13-99 showing a Type 3 ECG. Modified from ref. 4, with permission.