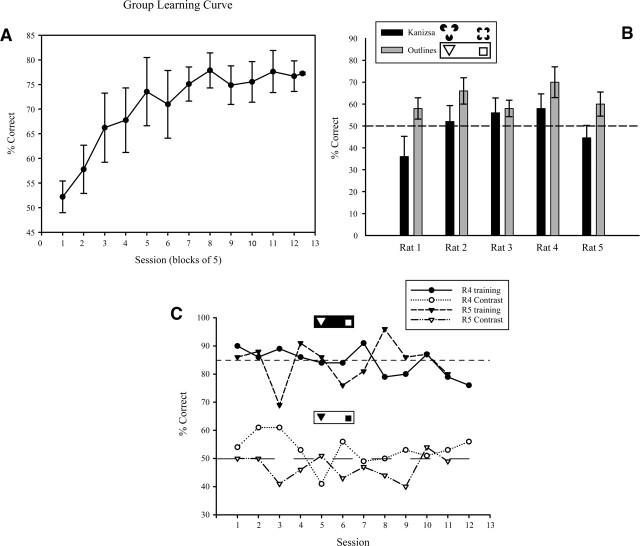
Figure 2.
(A) The group learning curve (means ±SEM) for training on the square-triangle discrimination (Experiment 1). (B) Individual transfer test performance (means ±SEM) on the Kanizsa and Outline stimuli. For illustrative purposes the Outlines’ stimuli in the graph are shown with reversed contrast polarity. The animals successfully transferred performance to the Outline stimuli but fell to chance or below for the Kanizsa stimuli. That this decrement may have been due to the reversal in contrast polarity is illustrated by the two rats shown in panel C, in which performance also fell to chance when the solid shapes were reversed.

